


Centerline Group | Furnished rental analysis
1240 Mariemont Rd Unit C
Sugar Grove, IL 60554 | 2 bedrooms | 2.5 bathrooms | Approx. 1,441 sq ft
This preliminary analysis assumes the property is already purchased, furnished, stocked and ready for guests. Figures start with the report's operating estimates. The owner's actual mortgage, taxes, insurance and HOA costs will determine the final cash-flow picture.
2027 base projection
2028 base projection
Year 1 / Year 2
Of available nights
Your carrying costs make the difference.
Use your mortgage principal and interest, property taxes, rental insurance and HOA dues when reviewing the projected return. The base case below shows both owner operation and professional management, before existing mortgage payments and income taxes.
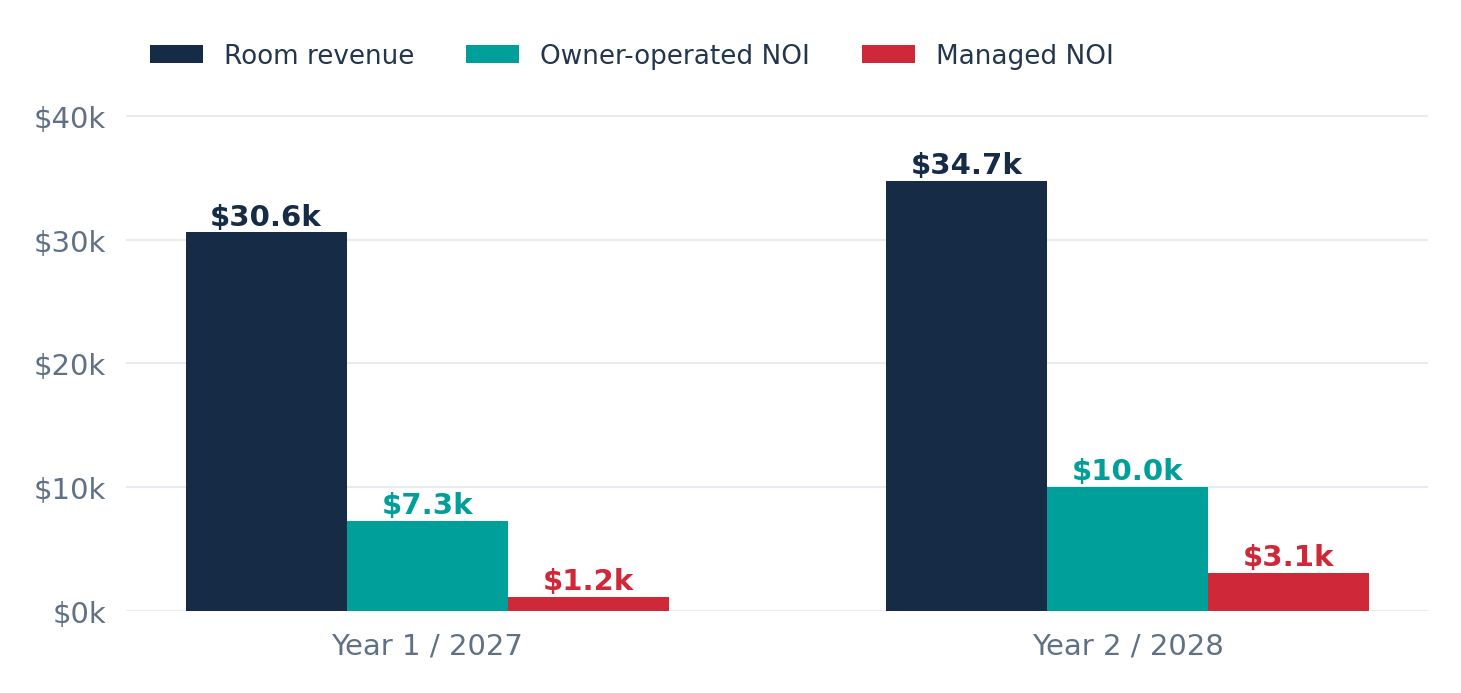
Review my rental scenario with JohnRevenue and operating income
Room revenue excludes cleaning charges. NOI is shown after recurring operating costs and before financing, replacement reserves and income taxes.
A seasonal booking calendar
The model assumes a slower review-building first year and more demand in summer.
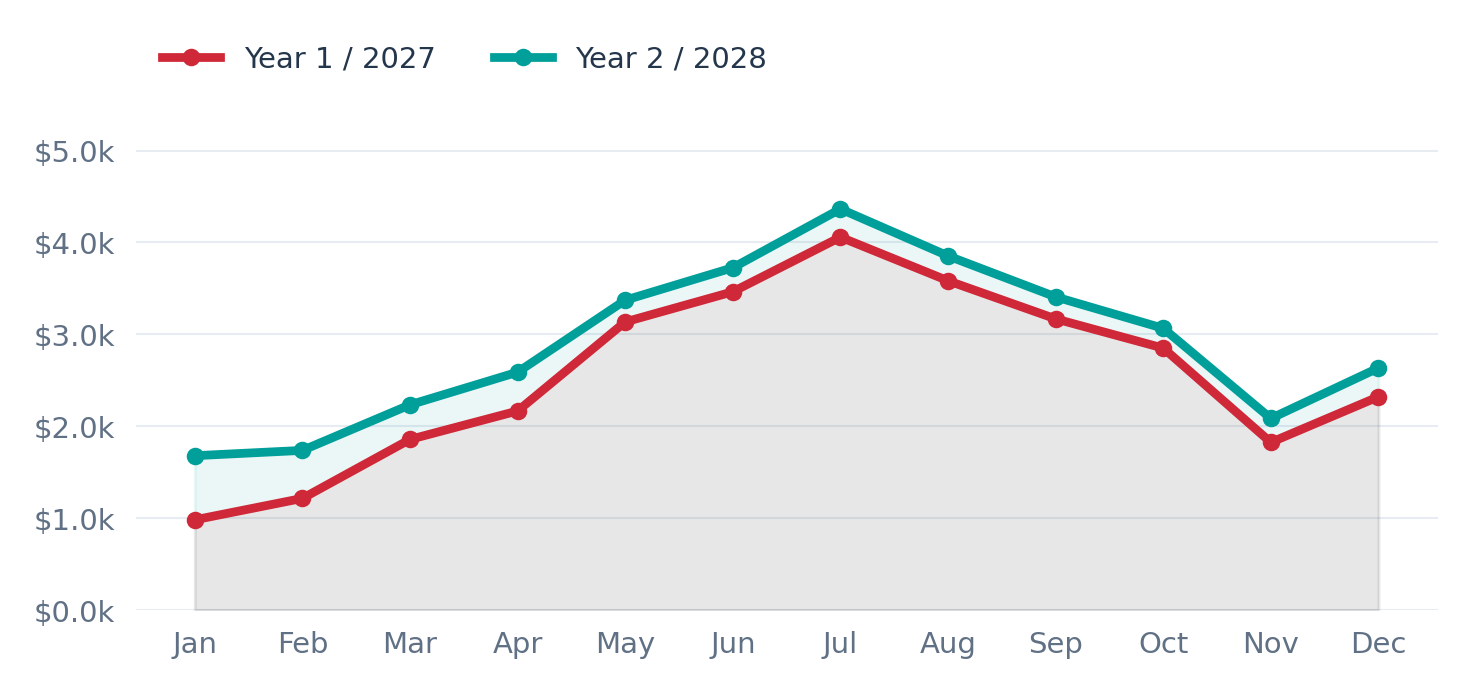
Seasonality is modeled, not historical booking data for this unit.
Cash generated over two years
The forecast starts at $0 new setup spending. Future replacement reserves are still deducted.
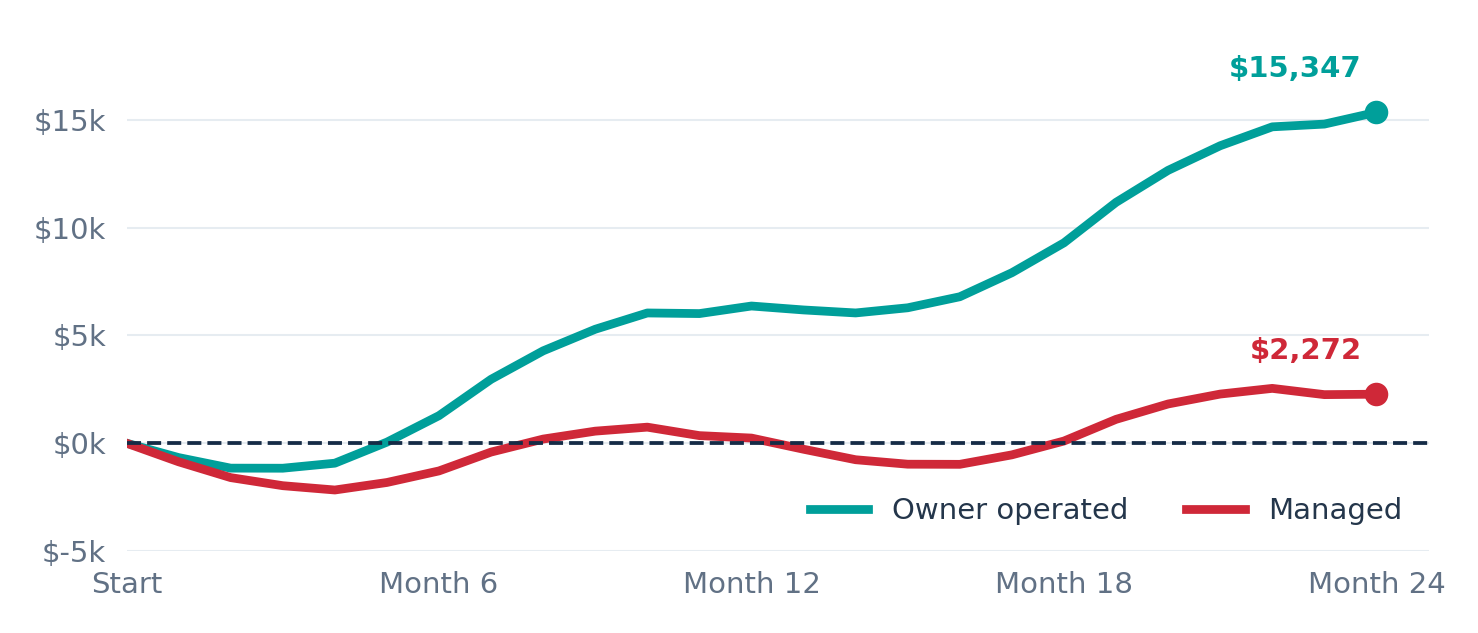
Early winter deficits can require operating cash even when annual results are positive.
The base case at a glance
| Annual forecast | Year 1 / 2027 | Year 2 / 2028 |
|---|---|---|
| Room revenue | $30,625 | $34,749 |
| NOI - owner operated | $7,281 | $10,027 |
| NOI - professionally managed | $1,156 | $3,077 |
| Cash after reserves, before debt - owner operated | $6,362 | $8,984 |
| Cash after reserves, before debt - managed | $237 | $2,035 |
The base case includes assumed property taxes of $6,500/year, insurance of $1,800/year and HOA dues of $300/month, with 3% Year 2 cost inflation. Management is modeled at 20% of room revenue; cash figures deduct a 3% room-revenue replacement reserve. Owner operation assigns no wage to the owner's time. Actual existing mortgage payments must be deducted from the cash figures. Already owning the property does not establish that it is mortgage-free.
Return on the property you already own
At an illustrative $300,000 current property value, owner-operated NOI implies a 2.4% / 3.3% cap rate in Years 1 / 2. Cash after reserves and before debt implies a 2.1% / 3.0% asset cash yield. The $300,000 value is a modeling assumption, not an appraisal.
A return on $0 new setup spending is undefined. Your actual cash yield on equity requires the current property value, outstanding loan balance and mortgage payments. No appreciation, principal-paydown benefit, sale proceeds or income-tax effects are included.
Nearby properties to compare
These publicly listed rentals help compare amenities and guest capacity. They are not verified revenue or nightly-rate comparables.
| Property / market | Guest offering | Comparison |
|---|---|---|
| 2BR Comfort Near I-88 / Aurora | 2BR / 1.5BA; 4 guests | Townhome, laundry, garage, workspace |
| Whispering Feathers / Aurora | 2BR / 1BA; 4 guests | Duplex, kitchen, laundry, parking |
| 2BR + Office Apt / Aurora | 2BR / 1BA; 4 guests | Separate office; no on-site laundry |
| Relaxing Riverfront Townhome / Yorkville | 2BR / 1.5BA; 6 guests | Waterfront, garage, laundry |
No verified booked-night counts, property-level ADR or revenue records were available for these listings. Precise distances are not claimed; exact addresses are not public. Regional data, source dates and methodology appear in the full report.
Review the complete analysis
The report includes regional market benchmarks, nearby amenity comparables, expense assumptions, conservative and upside cases, and return calculations.
Download the full PDF reportTalk with John MontgomeryPrepared November 2, 2026. Opening modeled for January 2027. No new acquisition, furnishing or setup cash outlay is charged. Taxes, insurance, HOA dues and financing have not been verified from owner records.